This is a low cost 4 kHz - 30 Mhz digital output (USB) spectrum analyzer. in 4 kHz steps. Idea is from A Spectrum Analyzer for the Radio Amateur Part1 & Part2.
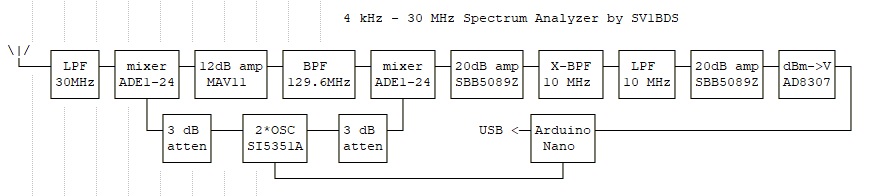
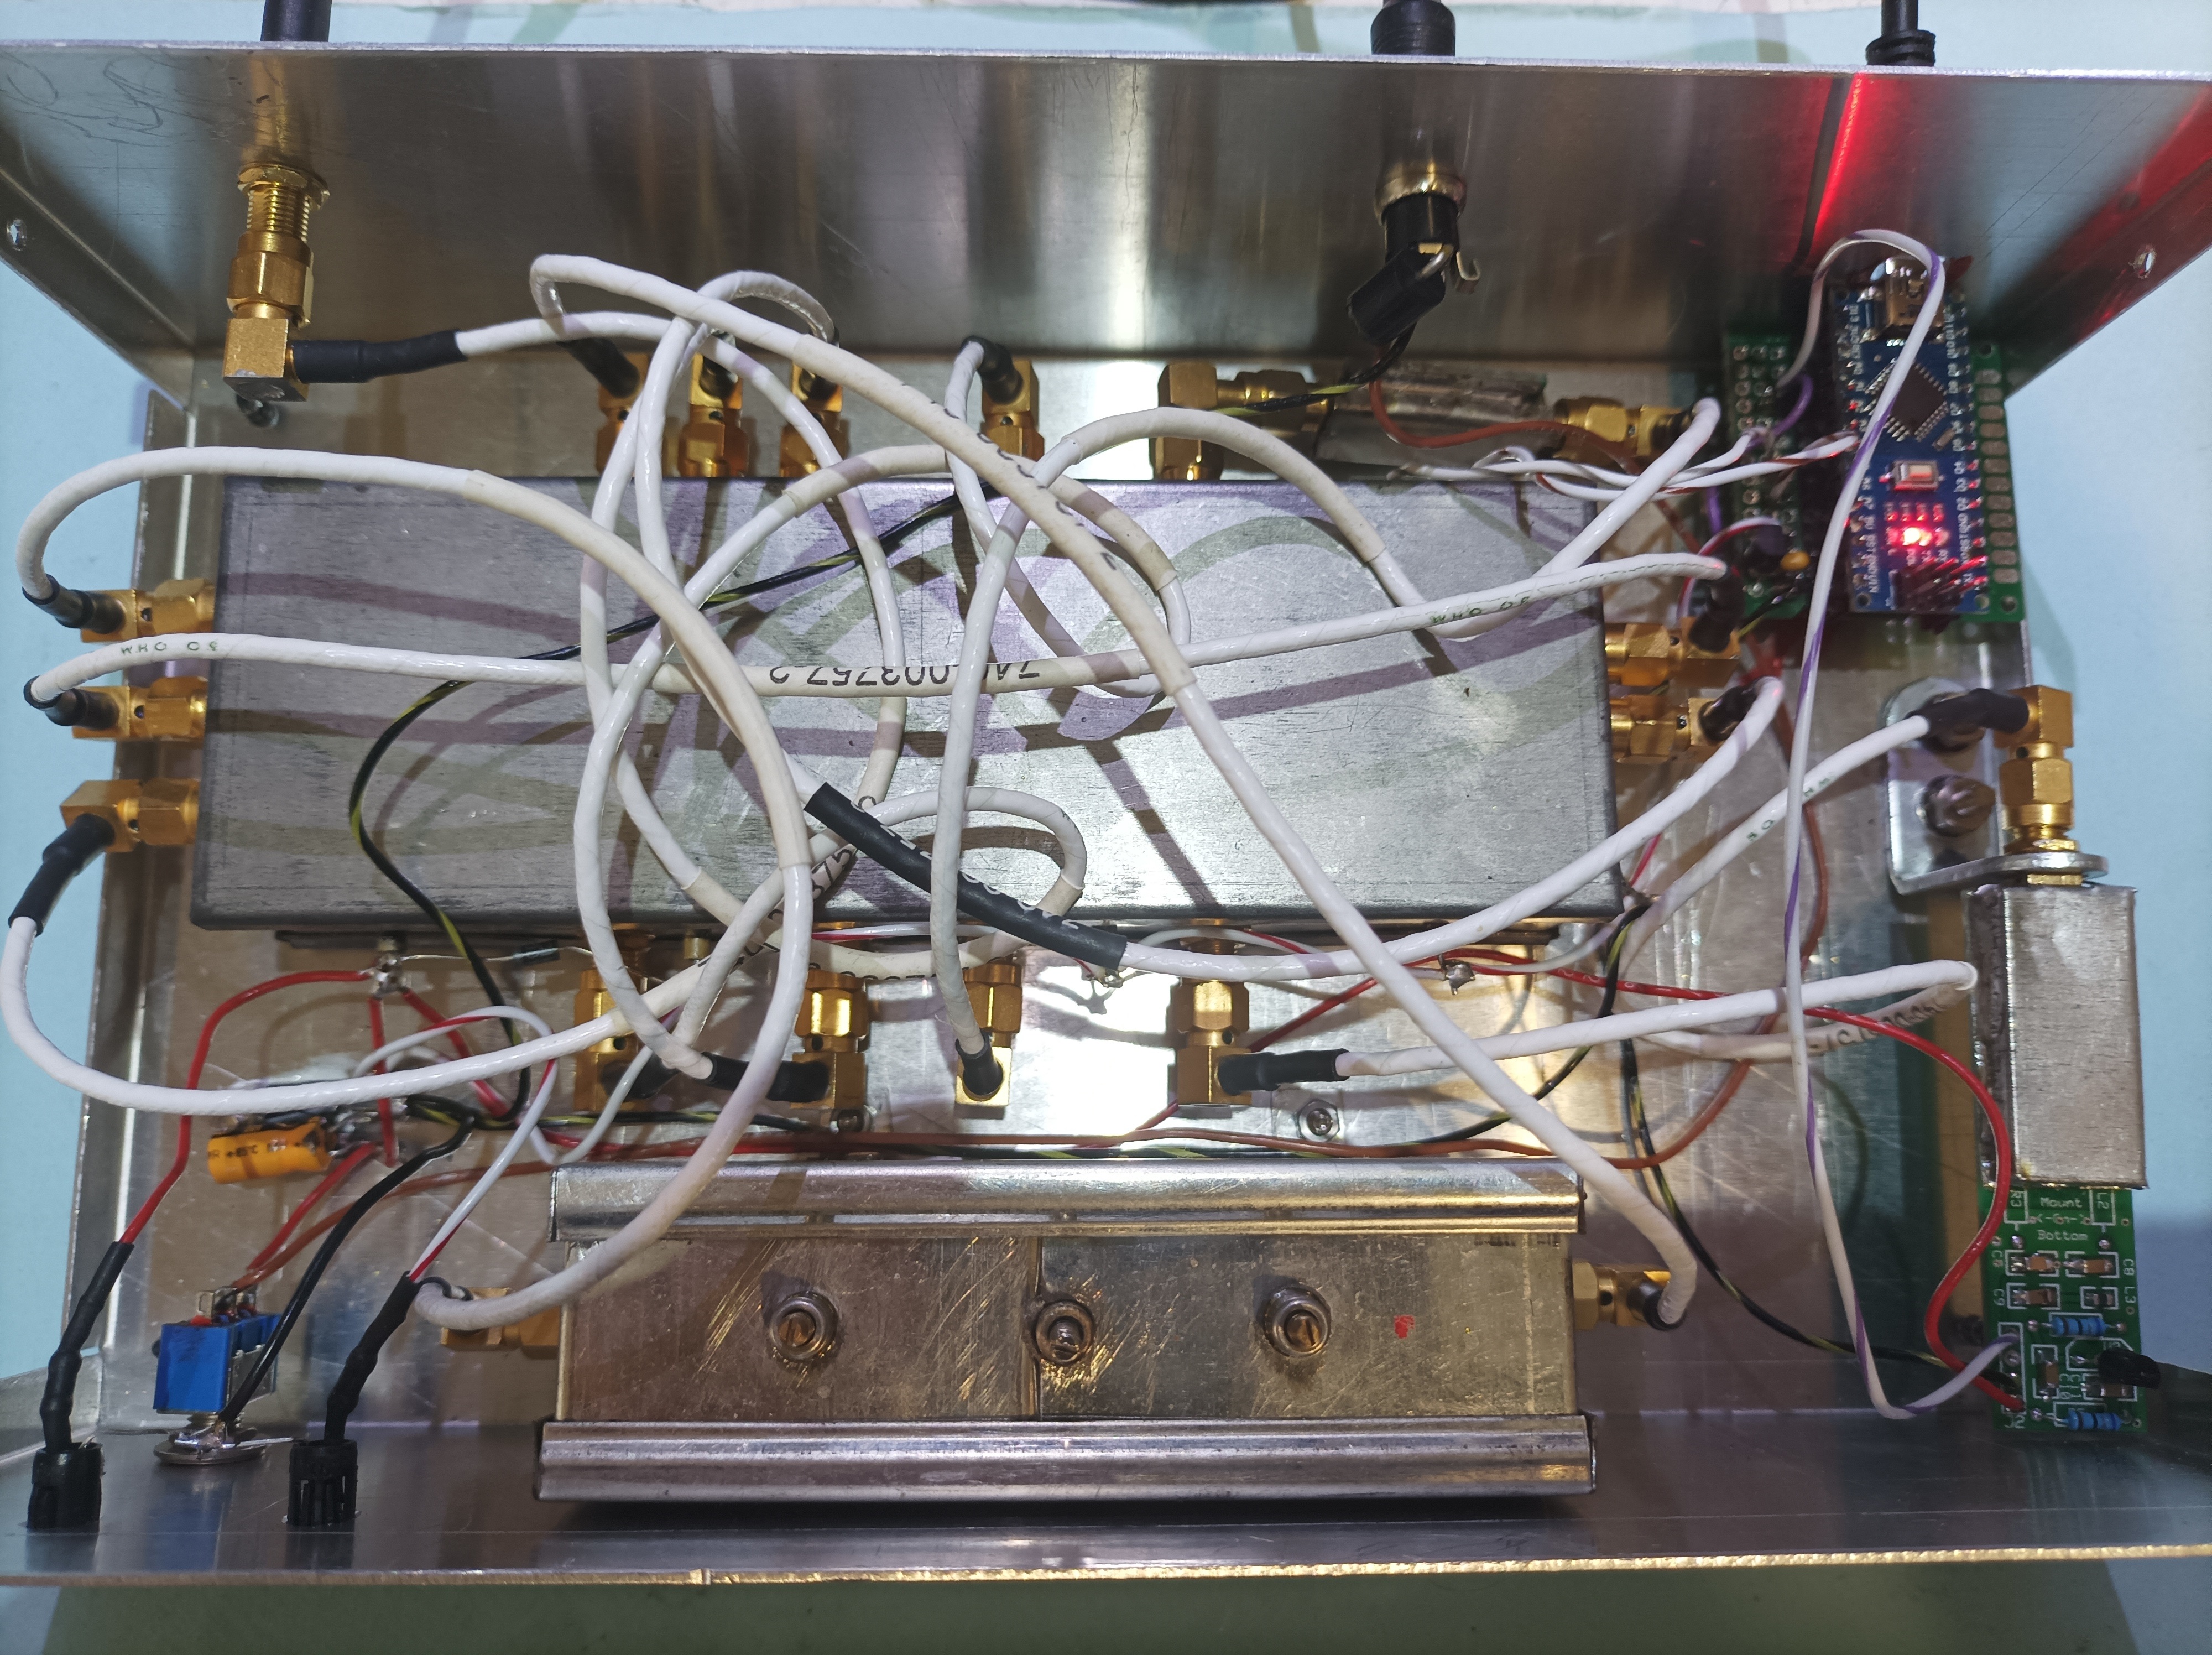
The 1st IF is 129.6 MHz, so the 1st local oscillator is from 129.604 up to 159.600 MHz in order to cover 7500 steps of 4 kHz. Each frequency step stays for 8 msec, so the total duration is exactly 1 min. The Arduino nano PCB send the frequency to the SI5351 PCB. The eBay low cost ADE1-24 mixer and the MAV11 MMIC give the mixed signal to 129.6 MHz BPF with 3 MHz bandwidth.
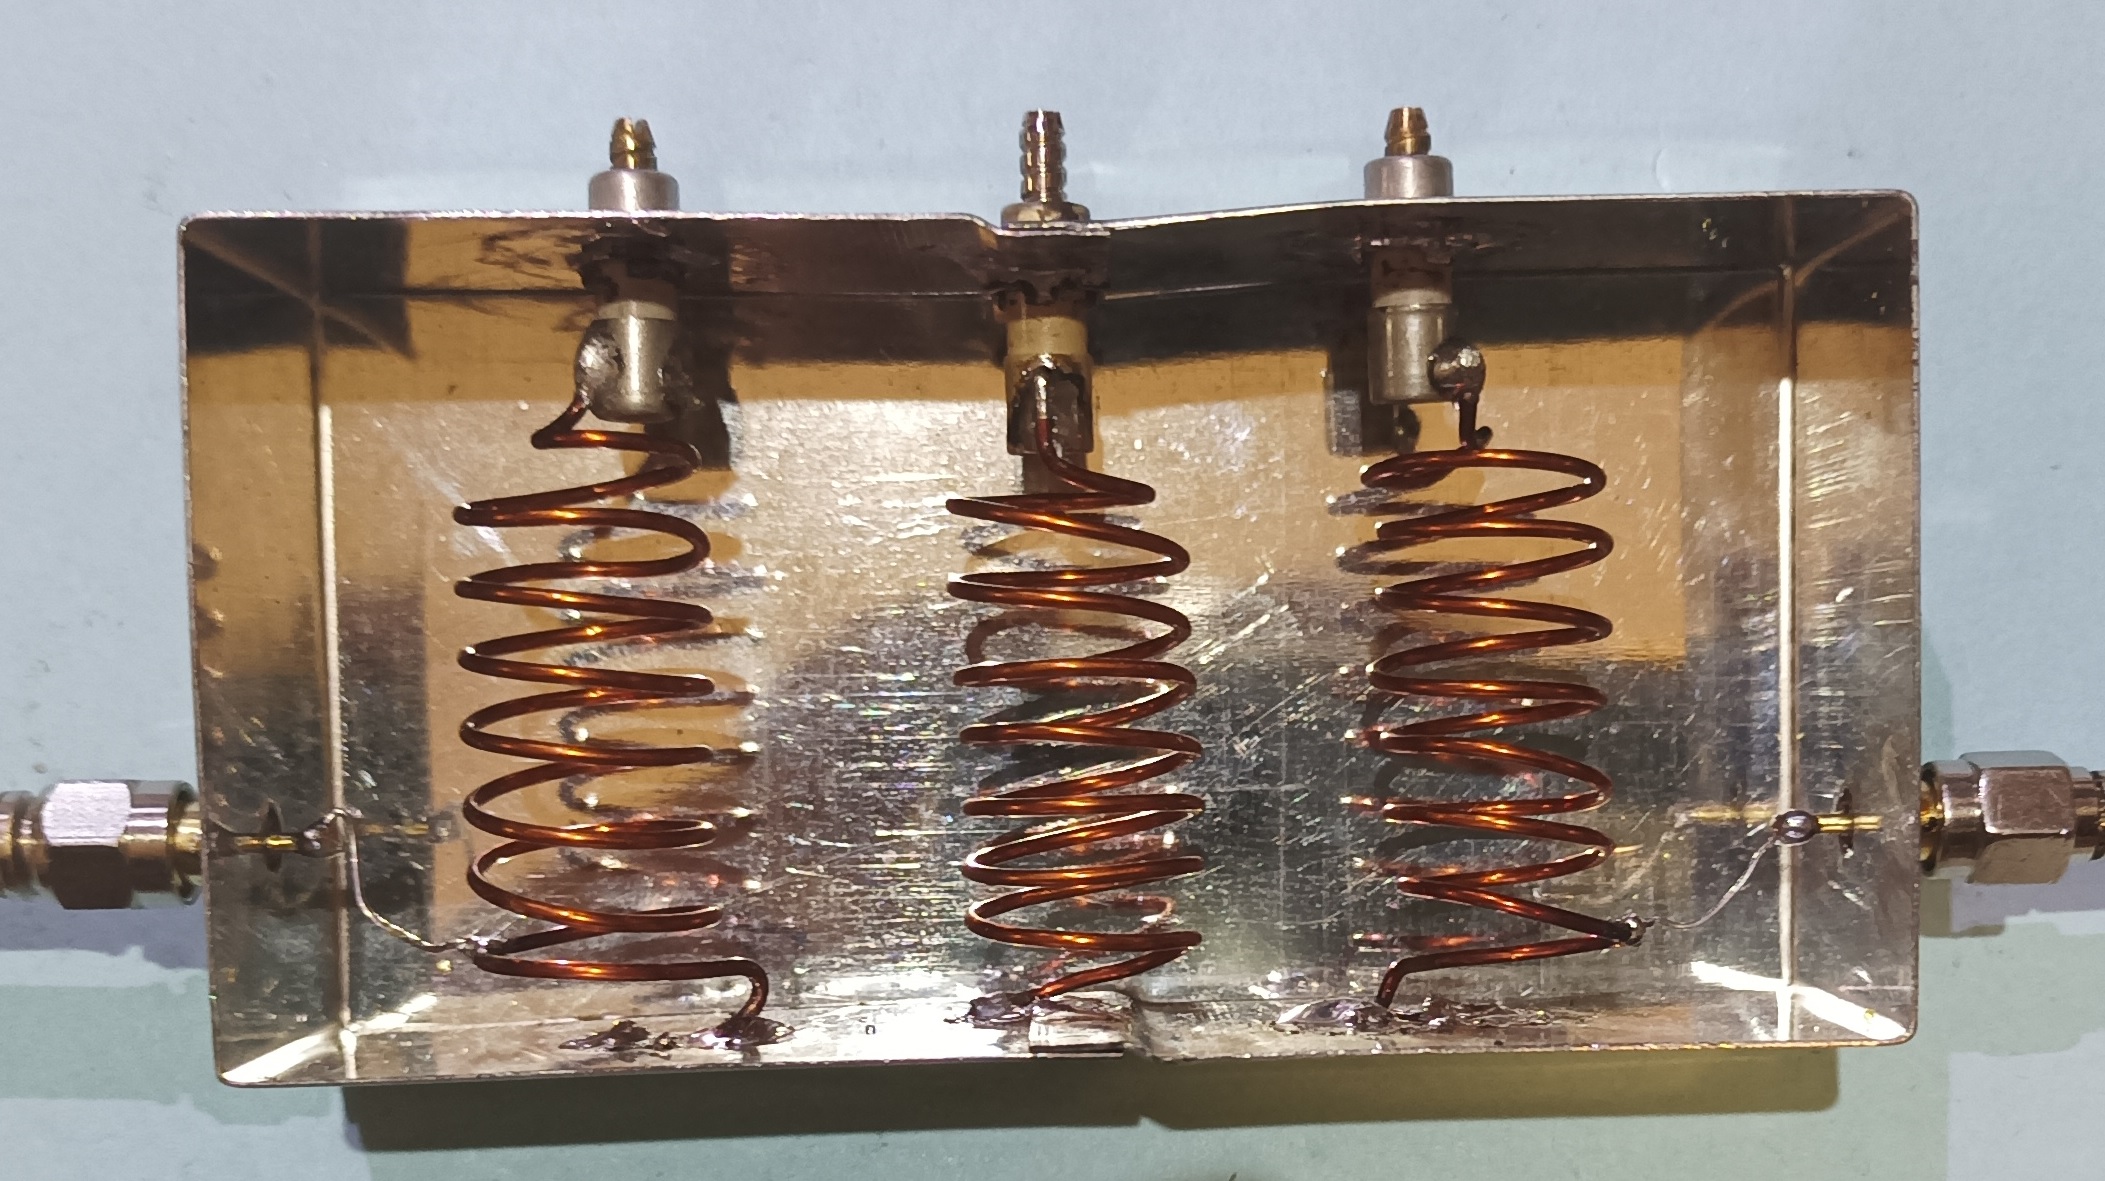 The filtered signal is feed to the 2nd mixer with ADE1-24 also. The 2nd local oscillator is 119.6 MHz in order to provide the 2nd IF of 10 MHz. It is first amplified with a SBB5089Z MMIC amplifier and then feed to the 7 crystal 10 MHz band pass filter. I used for SBB5089Z PCBs from W1GHZ instead of mine due to smaller size.
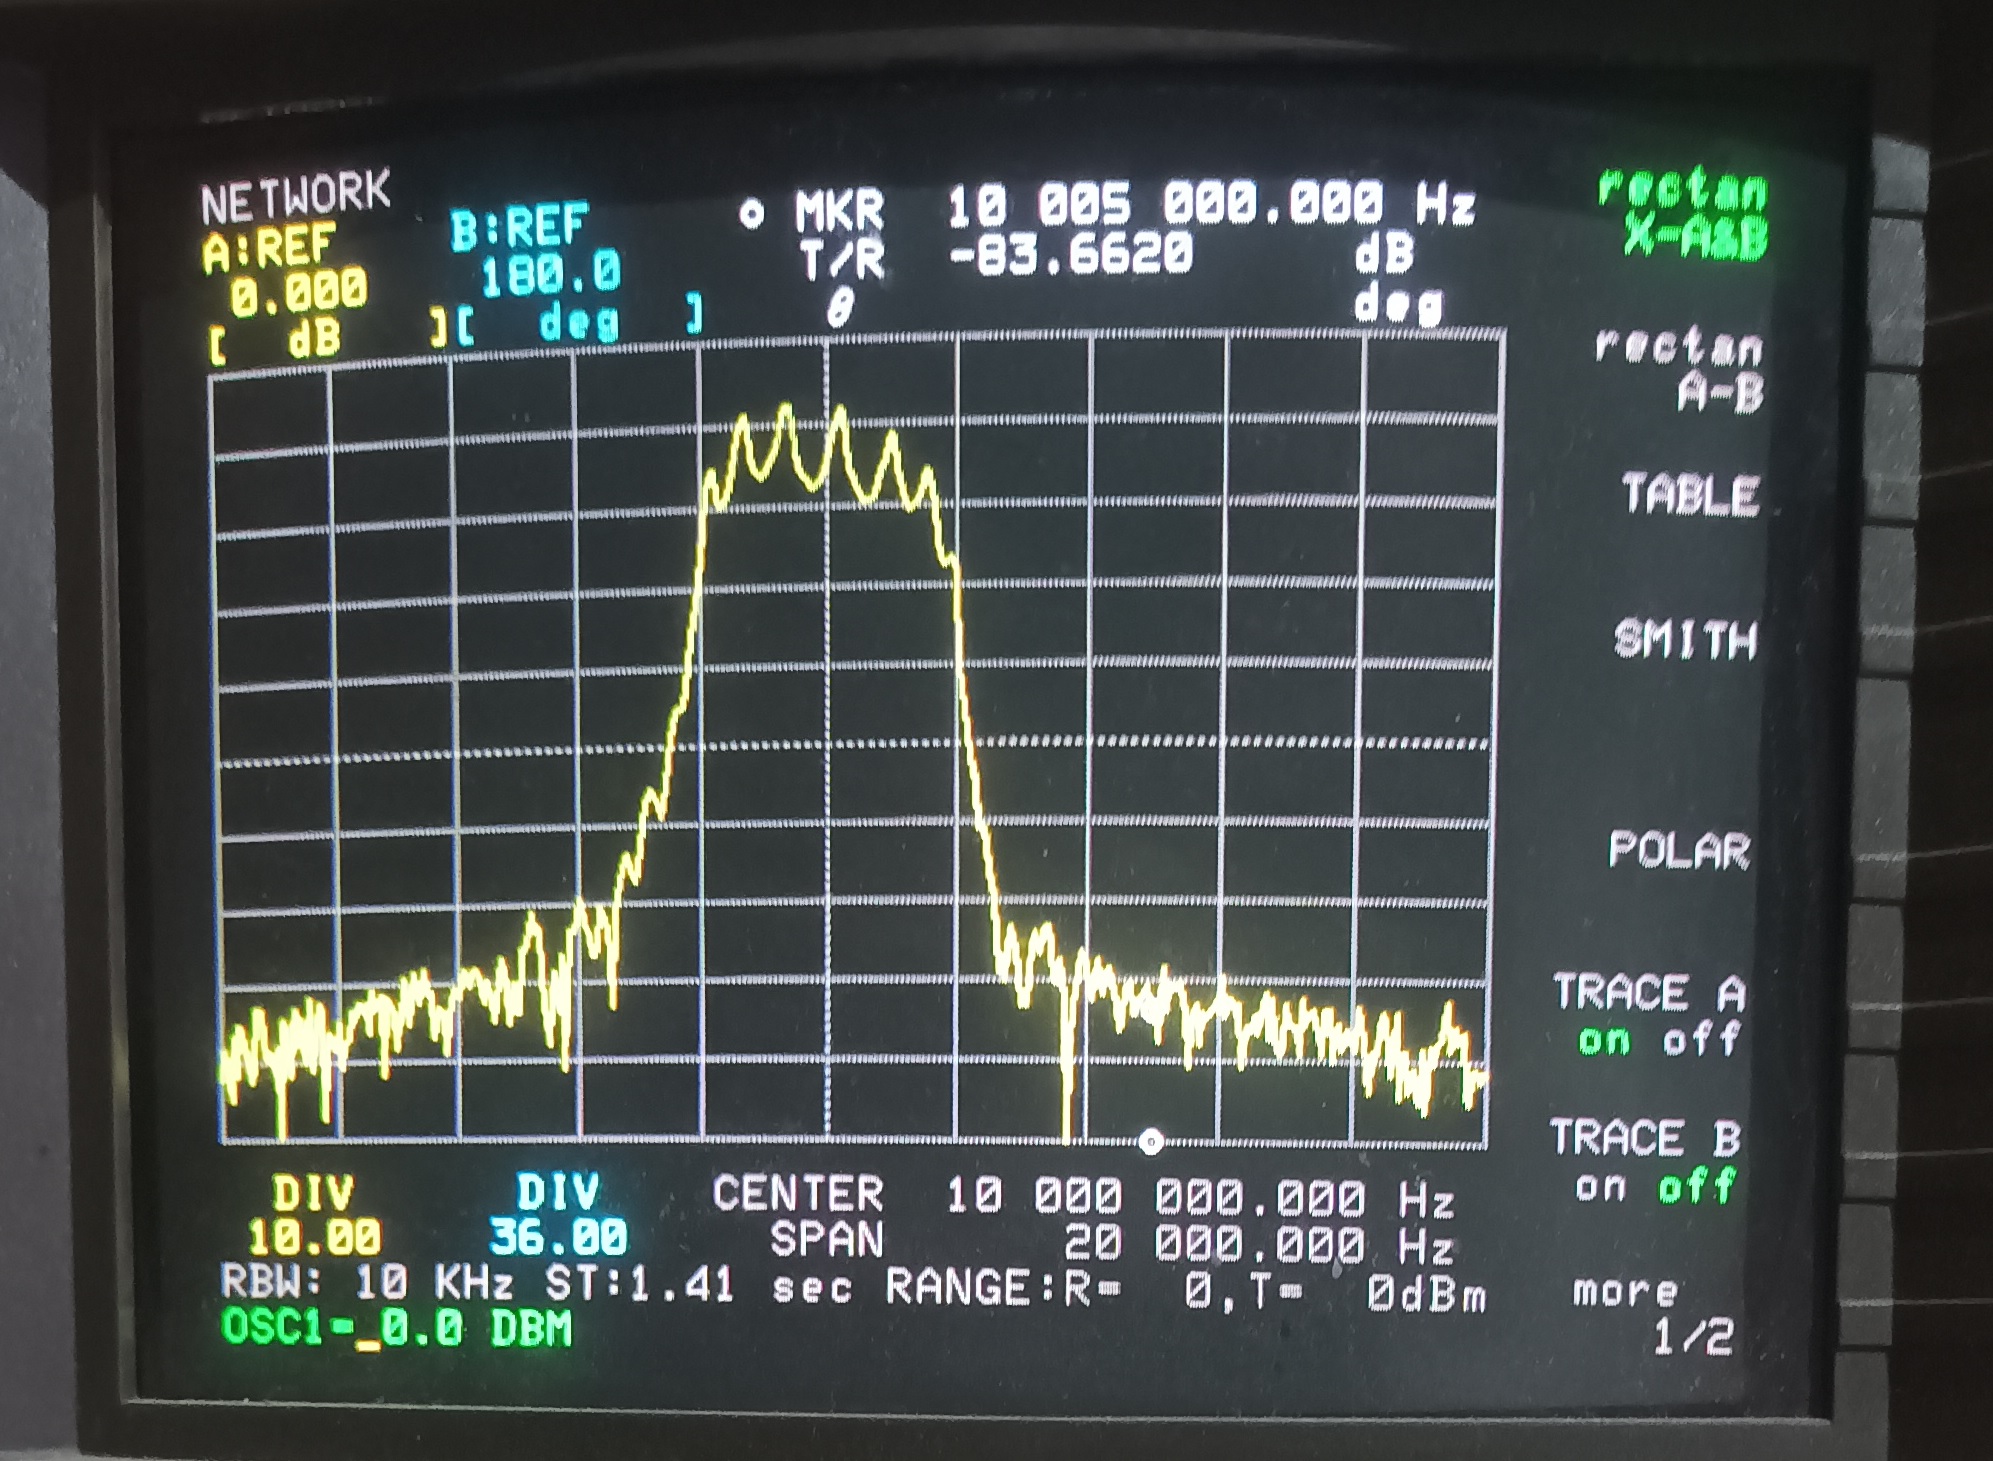
This has a bandwidth of 4 kHz and a ripple of about 10 dB. A 10 MHz low pass filter is following in order to eliminate the VHF frequencies that pass through the crystal filer. A second SBB5089Z MMIC amplifier is feeding the AD8307 dBm meter. It's output is driving a ADC of Arduino nano PCB equipped with a MCP1525 2.5 V voltage reference. A total of mean 30 dB gain exists from antenna input until the AD8307. So the -70 dBm lower limit of AD8307 converted from about -90 dBm signal input. A -10 dBm input signal produce +20 dBm which is the limit of both SBB5089Z and AD8307.
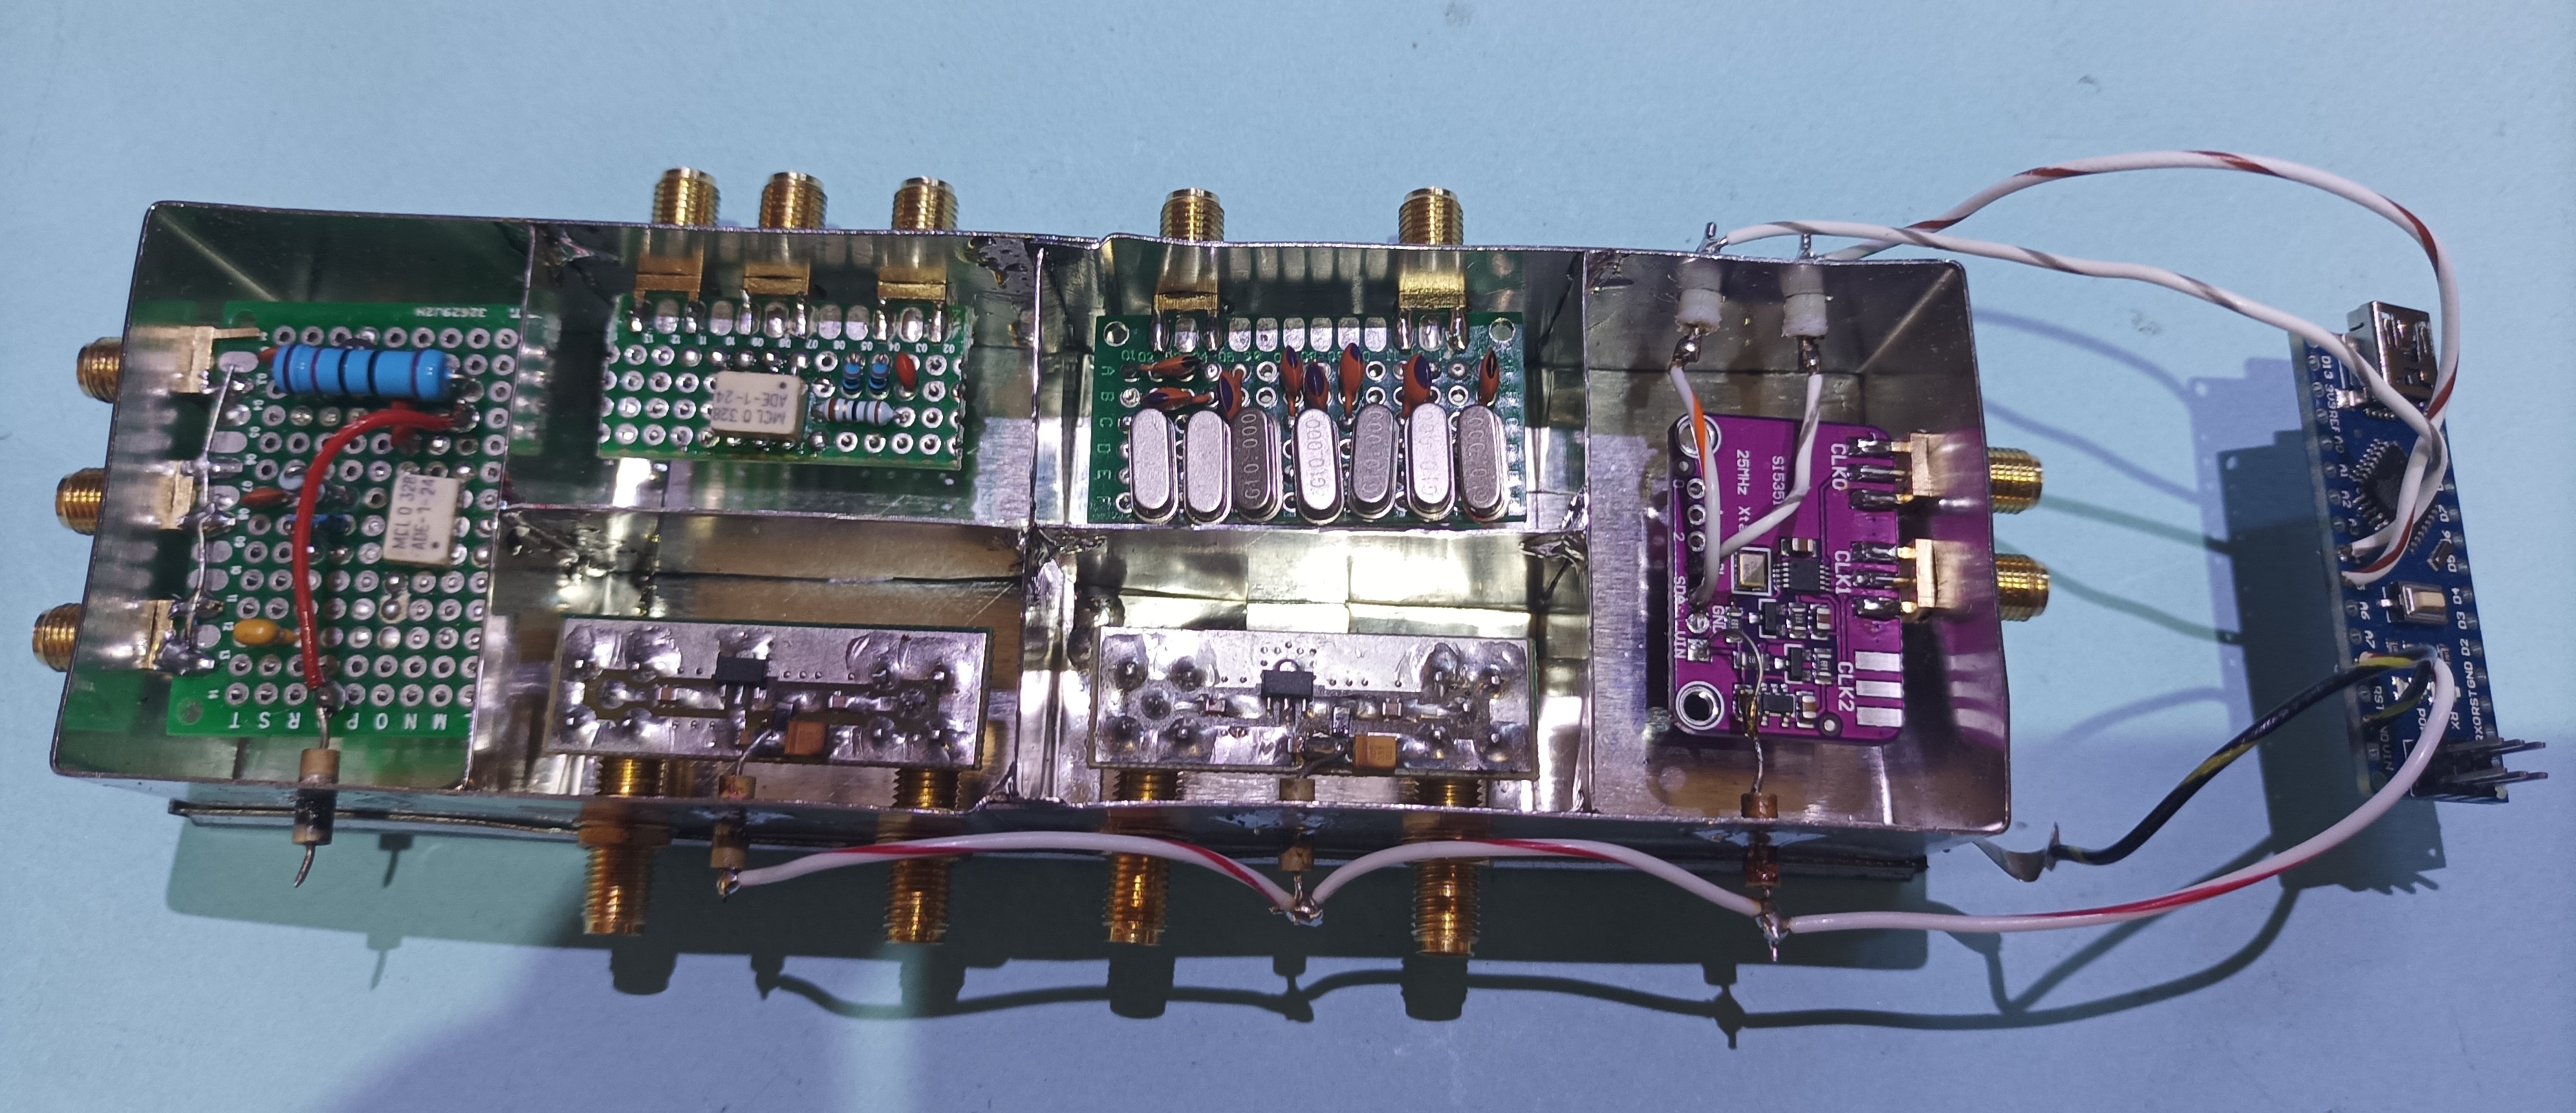
Carefully construction using double sided prototyping PCBs used in many stages. For SBB5089Z it is not recommended to use protyping PCBs as it is a 6 GHz device. For the AD8307 a PCB similar to AD8307 power meter is used.
 The code is based on SI5351 library and Atmel Studio is used. The received ADC value is send to USB serial interface. The 5V power is not used in order not to mixed the two 5V power supplies as the spectrum analyzer has his own power supply. A Python3 script run as service is grabbing the ADC values and stores them to a daily file. A crontab entry running a bash script every day create the produced daily image that is feed to the www server. Python3 is used to create plot image using matplotlib. It must mentioned that staying signals are substracted from each measurement .
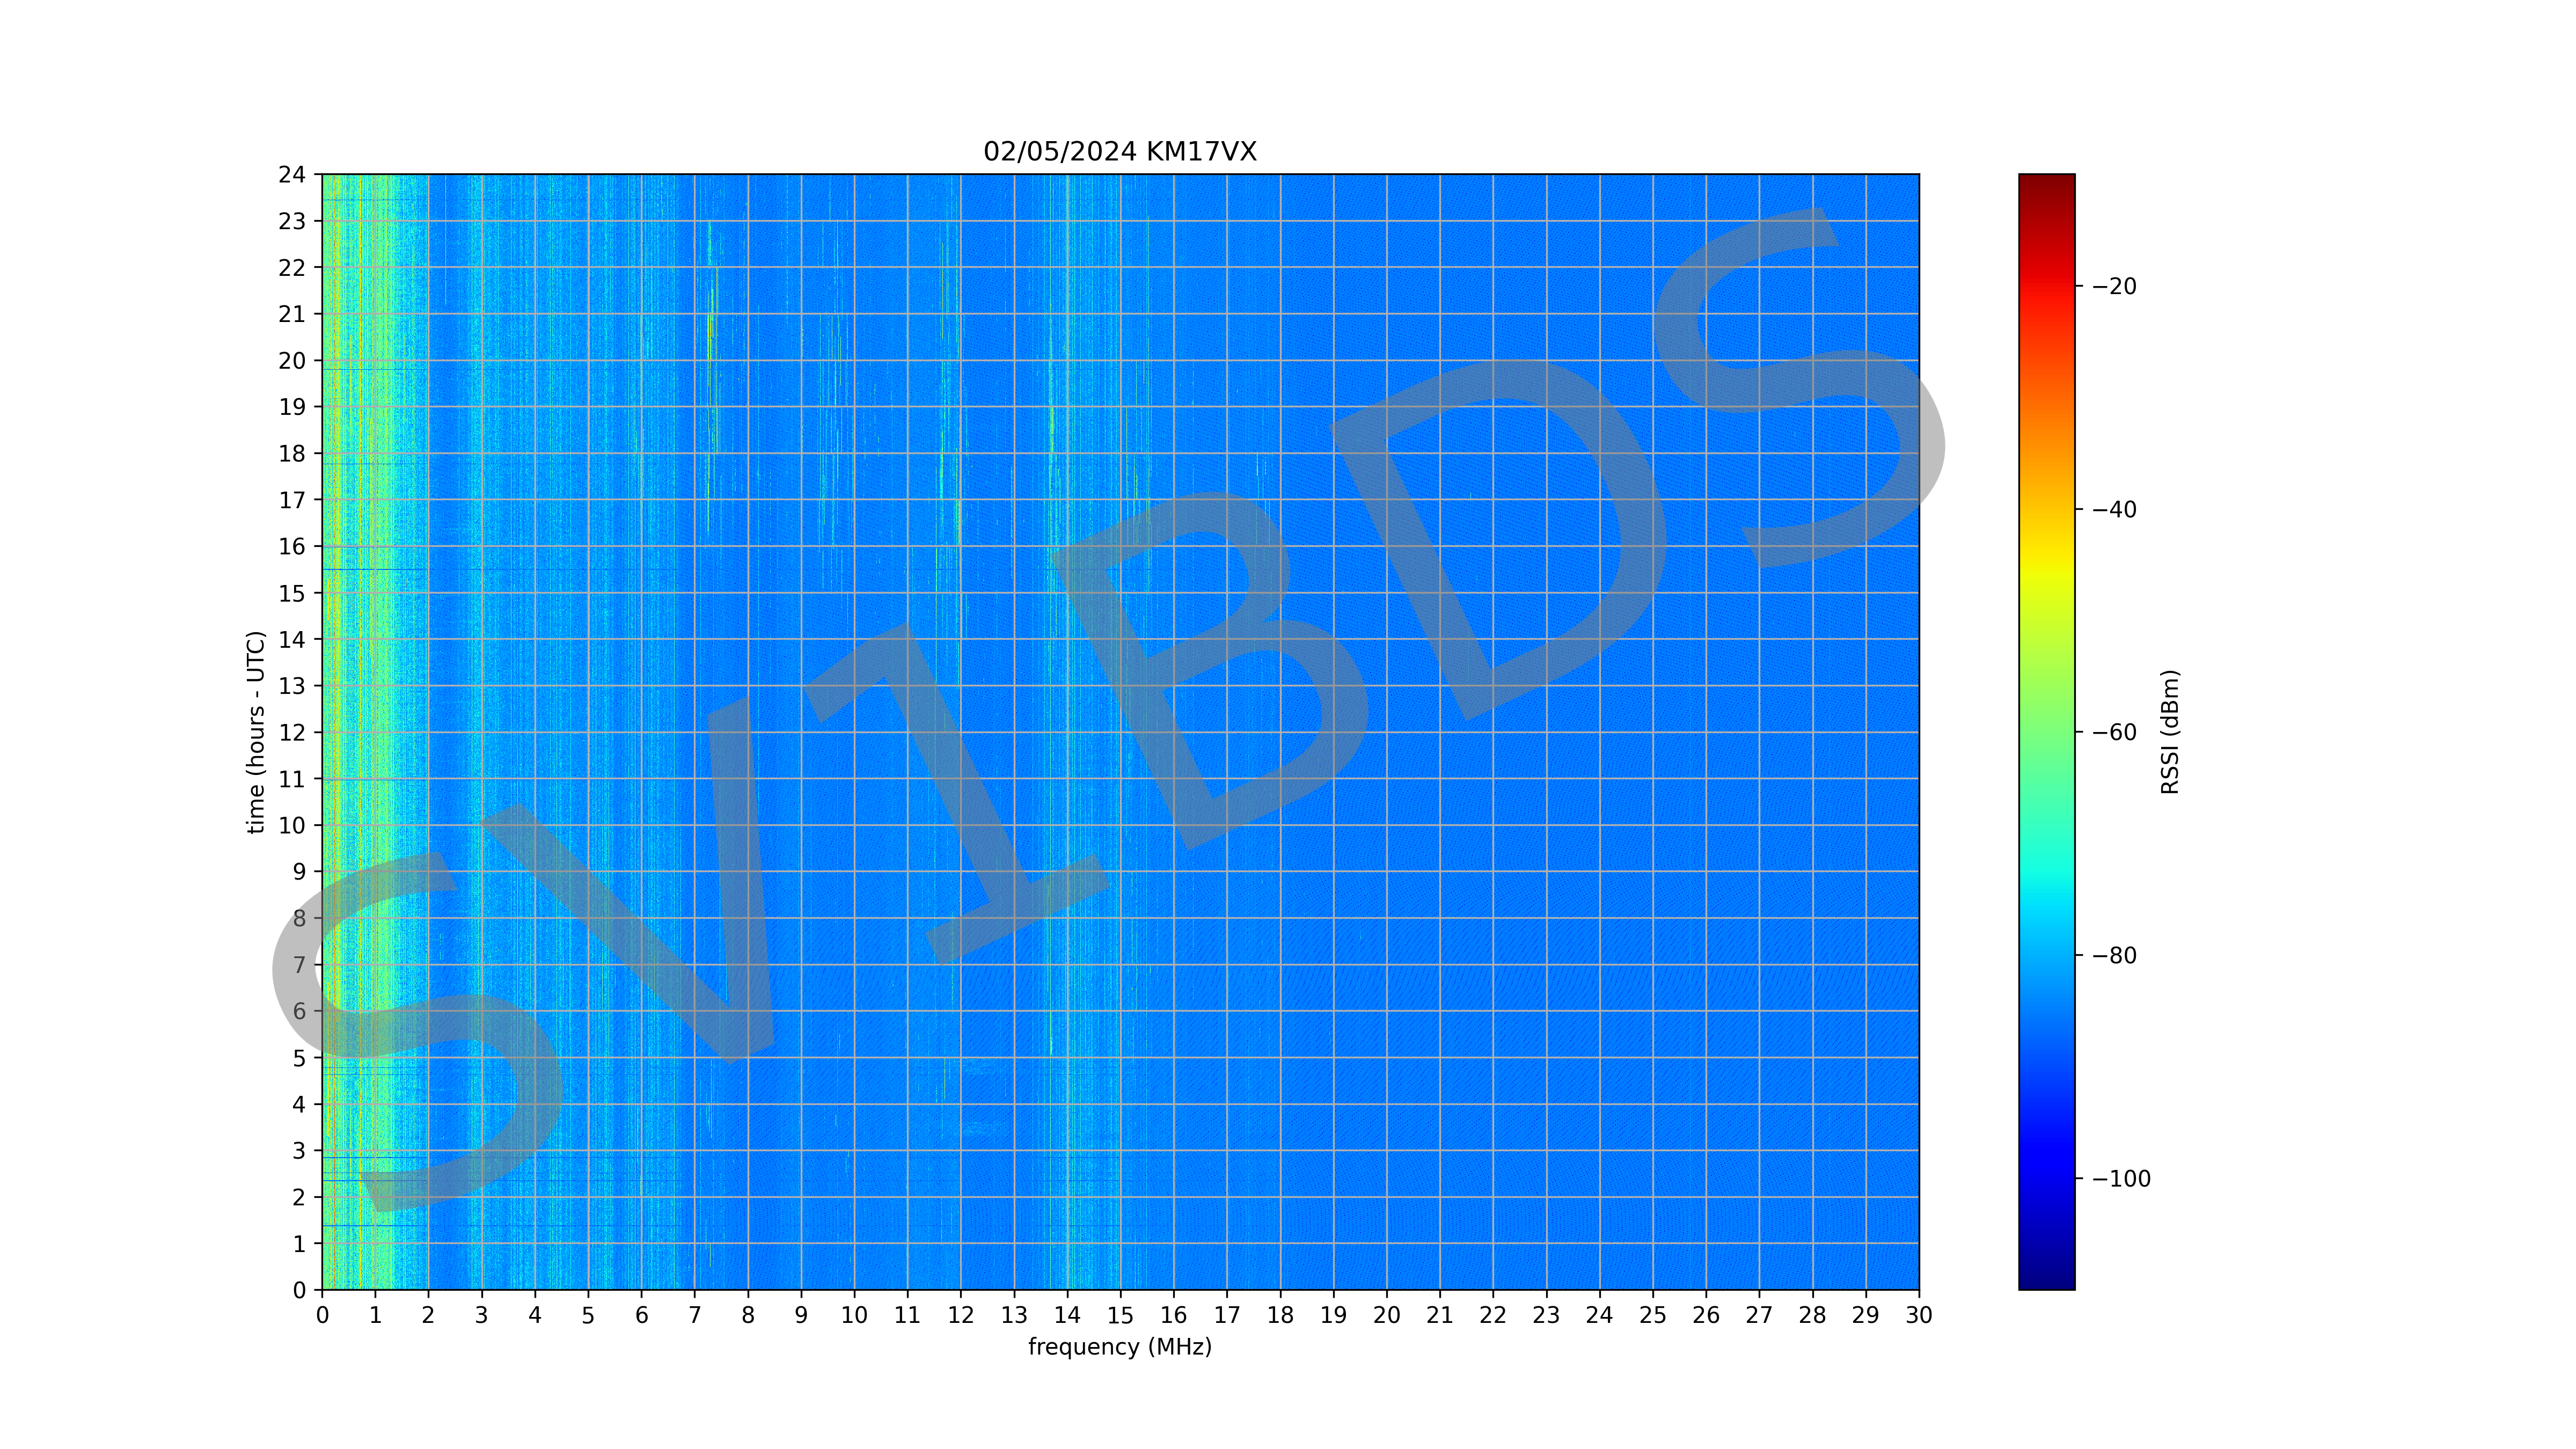
The produced image can be viewed from home page.